Empower my brand
Empower my brand

An Incredible Alternative to Questionnaire-based Research

Questionnaire-based research methodologies have their own well-known limitations. It is tragic but true, that we realize this fact only in retrospect, after we spent tens of thousands of dollars! Most often, they are derailed by the use of either the wrong sample or the wrong questions, or both. What if there was no such limitation? What if we could structure quantitative studies in the same open-ended manner that we deploy in qualitative research and still derive the quantitative insights we wanted? We explore the limitations of questionnaire-based methods and propose a possible solution.

The practices of market research might seem simple to the lay person. All it involves is this: We determine/choose a sample of respondents, present them with a pre-designed questionnaire to which we elicit their answers, collate them and extrapolate the insights offered to a larger audience and publish our findings. This may all seem very simple, but the reality is that market research is an involved science. Designing the questionnaire, selecting the sample of respondents and administering the questionnaire are all as scientifically determined as the methods applied in running a credible statistical analysis on the results. Each one of these steps offer multiple nuances,  on account of the multiple options and methods involved in the process.

The result of such complexity and nuances in market research methods is that not all studies are successful. How many times have we questioned the results after an expensive study? There are several things which could have gone wrong.

Let’s look at some potential sources of such errors in a questionnaire-based survey. You’d understand that these limitations and biases impact consumer research more frequently than one would imagine:

  • Selecting the population: The sampling frame selected and the weightages attributed to extrapolate it to a larger group may not truly represent the population. We see this error particularly affecting the prediction of election outcomes. Collecting the opinions of the wrong crowd is bound to result in wrong findings.
  • Biased Questionnaire: The researcher’s own point-of-view could creep into the way the questions are designed and the answers are interpreted or analyzed. This error is not measurable and can be very subtle or quite purposeful in the way it could cause the results to go wrong. Even senior researchers fall prey to this error, mainly because opinions about some topics, like religion, secularism, marriage, discipline or education (to name a few), are strongly entrenched for most people.
  • Not from a Random Sample: The very act, of distributing a questionnaire and collecting responses to it, makes the possibility of obtaining a random sample difficult, which affects the reliability of the statistically derived predictions. To illustrate, the very fact that all are willingly agreeing to fill out the questionnaire makes the survey non-random, but it can’t ever be fixed because the ones who refused to fill it out will not change their minds anyway. People who are offered incentives to take a survey could be biased.
  • Data not Weighed: It is important to weigh the data collected by the sub-group which willingly agreed to cooperate and respond to the questionnaire. Sometimes, surveyors fail to collect or incorporate this information, like gender or ethnicity, to weight the data and compensate for its effect on the predictions made based on the survey responses. Another way to control this error would be to quota the sample by deciding how many people belonging to each sub-group will participate in the survey.
  • Over-correction: When faced with concerns about possible errors and biases creeping into one’s data, researchers tend to over-correct it for every imaginable error. This could potentially skew the characteristics of the data and make it lose its capability to represent the larger population.
  • Miscellaneous:
    • Closed-ended questions have a pattern in responses, as respondents go by primacy and recency which weigh in for the first and last options.
    • The order in which questions are posed could influence the responses.
    • Leading/pointed questions, however subtle, impact the results obtained.
    • Saying ‘Yes/Agree’ comes easier than saying ‘No/Disagree’.

Research is still exploring ways and means to correct these errors and biases which could creep into one’s survey. Informed opinion asserts that an excellent alternative to a questionnaire-based survey would be collecting the voluntary responses of consumers, given without any prompting or incentive, making social listening important for market research.

What if there was no need to set out with a set questionnaire? Just like in qualitative research, but then with a sample large enough to enable us to derive quantitative insights? What if we could eliminate, to some extent, such biases from impacting our research?

The answer to these “what ifs” is a method where one could have access to an infinite set of consumer views which could be mined to understand their possible responses to multiple questions. Large data sets of, voluntarily offered, consumer opinion help remove the constraints on the number of ways we could slice and dice the sample of our choice, answering a hundred different questions.

Auris, our AI-powered consumer insights tool is an attempt to make this wish come true. With Auris you have an incredibly large sample of all consumer feedback which they have expressed of their own volition. A researcher can now look at the cohorts of their choice and seek answers to as many questions as come to mind. Your research therefore yields trustworthy results because you gain the ability to listen to an unlimited amount of feedback in real time, from a random selection of people who voluntarily provide it to you.

What Sample Size is Acceptable for Qualitative Market Research?

All marketing practitioners who have taken up consumer research would have encountered the question – how big should the sample size be? For qualitative studies, the answer typically is: “As big a sample size as you can afford to have. The more the better!”. Auris takes the ‘sample size’ out of the equation and makes this question redundant. Imagine qualitative research with significantly large, unprompted views of the consumers, rather than just a handful of views. For those interested in research techniques, here’s some more detail you might find interesting.

When deciding the sample size for a qualitative market research project:

  • Do we follow Patton (2002) by accepting that even 1 case is enough for research which does not have theory-building as core focus, and plans only to explore an issue or offer depth to quantitative data? After all, according to Patton (1990), a researcher needs to focus on what is doable or feasible; because sampling to the point of redundancy requires unlimited timelines as well as unlimited resources.
  • Or, do we follow Saunders, Sim et al. (2012) who ask us to stop sampling only after we reach theoretical or conceptual saturation, if we aim to build a theory? If saturation makes further data collection unnecessary, we need to ensure that its operationalization is consistent with the research question, the theoretical position and the analytic framework adopted.

Let’s consider the issues involved.

  • Qualitative research indicates that it does not rely on any quantitative necessities, like sample size. Typically, it requires smaller sample sizes than quantitative analysis would.
  • Sample size in qualitative data analysis is measured by the number of themes or categories identified within the data.
  • Saturation is the point where adding new data does not improve the explanations of the themes or the categories or add any new perspectives or information.
  • Diminishing returns on qualitative data occur when more data leads to no new information, as one occurrence is enough to add the information to the analytical framework.
  • Gathering too much data and too many samples could make a research project impractical and time consuming, as each new piece of data brings in additional complexities.
  • It is important to capture all perceptions, but there is no need to do it on a repetitive basis, without adding any additional inputs to the research points being inquired into.

So, we accept that it is prudent for a qualitative researcher to take up enough cases to reach a saturation point where additional efforts will not be able to yield further useful information from the sample.

More about reaching saturation and why the sample size is important:

  • The size of a sample and the design of the project determine the time taken for a project to reach saturation. To illustrate, a study covering Waldorf education in India up to the seventh standard would naturally take less time to reach saturation than a study of education in general.
  • The amount of information obtained will also depend upon the interviewing techniques and skills of the interviewer.
  • Some projects have large sample sizes because:
    • The sample has heterogeneous population
    • The project uses multiple selection criteria
    • The study contains multiple samples
    • The project needs an extensive ‘nesting’ of criteria
    • The sample contains groups of special interest requiring intensive study.
  • There’s no scientific explanation or method for determining that saturation has been reached at a specific point in the survey.
  • Saturation is considered to be a matter of degree by some, with the potential for some new data to emerge.

Various factors decide the sample sizes in qualitative studies, and these suggestions range from 5 to 60, with 30, 40 and 50 being other significant reference points. Ultimately, the decision to call a halt to the study can be taken by the researchers, when they finally find that with each new interview they are unable to extract any significant new information to add to their data bank. That would prove to be the ideal sample size for their qualitative research study.

This is where an AI-powered social listening tool like Auris offers a market research team the unique advantage of being able to listen to an unlimited amount of feedback in real time. What’s more, these opinions, views or feedback are as random and unprompted as they can be, yielding highly dependable predictive analyses as the subjectivity which researchers tend to bring in is eliminated completely.


Auris Prediction: NDP is giving a Tough Fight to the PCs!

Our social listening-based analysis of the Ontario elections is finally drawing to a close. In the run up to E-day on June 7th, 2018, Ontarians have decidedly moved away from Liberals. There is no buzz whatsoever, leave aside a handful of ridings. Here is what it looks like to us:

  • Liberals are not in the fray. The fight is between NDP and the PC Party
  • Liberals have lost some of their loyal voter base to Andrea Horwath
  • NDP is garnering its votes on the plank of social welfare, healthcare and education policies and a well thought-out and costed platform
  • PC Party still has the momentum, especially in GTA ridings. Lower gas prices, job creation have helped.
  • NDP’s momentum is marred by the perceptions that it follows a “communist” ideology and will lead to further widening of the deficit because of wasteful expenditure.
  • PC Party’s “buck for a beer” perceived as frivolous. People are still asking for a fully costed platform.

Our predictions for some of the ridings where we see a decisive buzz indicates the following:

  • 23-24 ridings decisively for NDP: Ajax, Aurora, Bay of Quinte, Beaches, Brampton North, Brampton East, Brant, Bruce-Grey-Owen-Sound, Cambridge, Carleton-Missisippi Mills, Durham, Guelph, Haldimand-Norfolk, Haliburton—Kawartha Lakes— Brock, Nepean, Kitchener—Waterloo, London West, Lanark—Frontenac—Lennox and Addington, Oshawa, Ottawa West, Thornhill, Toronto Centre & Wellington are leaning towards the NDP.
  • 27-29 ridings decisively for the PCs: In contrast, PC Party seems to be ahead in the Barrie, Pickering, Brampton Center, Brampton South, Burlington, Don  Valley, Dufferin-Caledon, Glengarry—Prescott—Russell, all Mississauga ridings, Milton, Nepean-Carleton, Newmarket—Aurora, Niagara Falls, Northumberland—Quinte West, Oakville, Ottawa – Centre, Pickering, Scarborough,  Renfrew—Nipissing—Pembroke, Richmond Hill, St. Catharines, Sault Ste. Marie, Stormont – Dundas – South Glengarry, Sudbury, Timmins—James Bay, Whitby—Oshawa and Willowdale.

Riding by riding details are below:

The fight is close and NDP has greater momentum. PC have legacy and a core voter base. We’d know whether Andrea Horwath edges past Doug Ford to become the premier of the state. Or perhaps, Doug Ford shows resilience and makes it past her.


The Pulse of Voters in Ontario in the run up to the Elections (May 3rd Week)

In our last analysis we showed how the perceptions and responses of Ontarians were changing over the past few weeks, as seen from the lens of the PC Party.

Here’s our latest analysis and we see some dramatic shifts happening at the ground level (and as it manifests in the buzz online).

The summary thus far:

The buzz shows that the NDP and PC Party are head-on-head, with the latter leading in terms of positive buzz.

  • Liberals are lagging behind the NDP and PC Party. This is a significant change versus a week ago.
  • Regions such as Burlington, Brampton, Dufferin—Caledon, Durham, Niagara, Mississauga, Glengarry—Prescott—Russell, Newmarket—Aurora, Oakville, Ottawa, Pickering, Renfrew and Sudbury are learning towards PC Party
  • Several ridings with undecided voters
  • Lack of a fully costed out budget, “beer for a buck” campaign have not worked for PC Party
  • Perceptions of PC Party being anti-gay, anti-poor and anti-immigrant has led voters towards alternatives, primarily NDP.
  • A well thought out plan, perception of being focussed on healthcare, pro-social expenditure and pro-climate change helping NDP.
  • Perception that NDP is “communist” and will worsen the debt crisis is a drag on NDP’s momentum.

Here are the latest trends by riding. The missing ridings are those where we did not see much chatter.


Ontario’s Provincial Elections – What do People Want?

We put Auris, our AI based consumer insights engine to the task of identifying key issues which people are discussing in each riding of Ontario. We wanted to monitor how the issues people talk about change in the run up to the elections in June. We picked the PC Party as the anchor (we view the data from the lens of this party) because they seem to be leading as per the latest polls.

Some great insights emerge about a) what really matters to people, b) what messages resonate more and c) what issues concern them. These are changing over time . We will showcase what we see by analyzing the data which is already out there.

In summary:

  • There’s a positive reception to the pitch of accountability and responsibility.
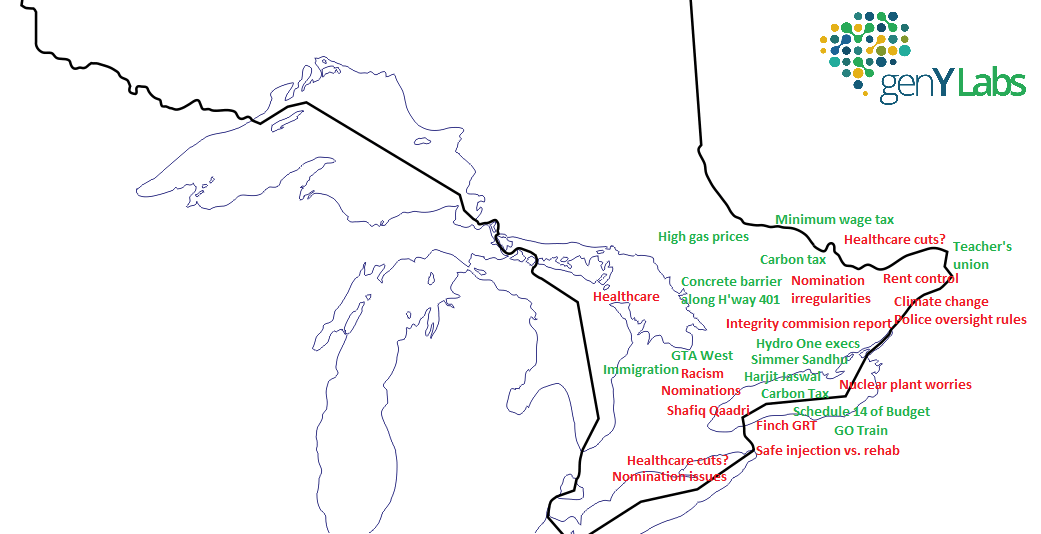
  • Citizens of Ontario are positively engaging in the discussions that affect them directly – transportation, healthcare, educational reforms, climate change, taxes and rent control.
  • We capture perception issues as well – the perceptions of the party reducing healthcare and welfare budgets and being anti-immigration.
  • The buzz has shifted from the nomination process to actual issues and the tempo has increased with meetings and announcement of policies on important matters.

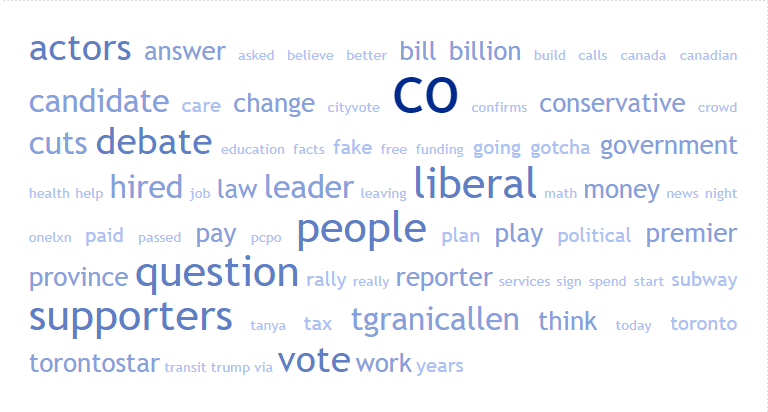
Not all ridings are abuzz on social platforms, so you’d find those ridings missing in here. Note that most of the chatter is on Twitter, though there’s chatter on Facebook pages as well as forums. Auris ingests all of the chatter and churns out relevant insights.


Ontario elections buzz map

A visual showing the issues by riding for the two weeks is shown here. This helps visualize the issues and their relative importance.

Ontario people issues tag cloud


GenY Labs and our Consumer Insights Engine ‘Auris’: The Beginning

My first “home visit”, a market research methodology very rigorously followed at Procter and Gamble (and I am sure at all major consumer facing companies) was a revelation. 3 of my colleagues and I walked into a Japanese household to speak with the lady of the house, looking for cues which would help us come up with a blockbuster creative concept.

I was new to consumer research and was there more to observe and learn. I saw my experienced colleagues engage the consumer in every-day banter about a range of things, navigating deftly from one topic of conversation to the other. The kind of informal conversation you’d have with your friend or colleague – with the purpose of understanding the person better.

By the time we left, it was amazing to see the amount of ‘non-obvious’ insights we had gathered. While understanding the consumer’s mindset, her product use context, perceived benefits from using different products were at the core of it, we left her home with several nuanced insights. What were her motivations in life, her feelings while she went about doing her seemingly mundane chores, and the like. The insights led to a creative concept which in turn led to our massively successful campaign. Our business moved 2 places up in terms of market share! I witnessed, first hand, how consumer insights can make a campaign, and eventually the brand!

This initiation into the amazing world of research has now, almost 15 years later, culminated into creating alternative methods to derive consumer insights – the gold mine which every marketing professional wants to explore. Giri, Yashwant & I, all experienced marketing professionals (& entrepreneurs) started GenY Labs to find ways to augment conventional research, leveraging the chatter that is already out there. Siva joined along, and then there were four. More joined in.

Our simple thesis has been as follows. We’d make an impact on the way research is done if we accomplished the following:

  • Can we get actual consumer views expressed on the Internet and mine them?
  • Can we accomplish this at a speed which is significantly better than conventional – think seconds and minutes vs. weeks?
  • Can we get a significantly higher sample size, so that we are confident of the findings?
  • Can we do this at a cost which is a fraction compared to conventional research?
  • Can we make it easy to do, so that every marketing professional, in organizations big and small, can benefit from these consumer insights?

In the past few months, we are seeing the green-shoots of success. Auris, our insights platform is out and is being accepted and appreciated by customers across industry verticals. I believe we are onto something significant.

Ravi (Co-founder, GenY Labs)


Mining the Buzz around Automobile Brands – Honda and Volkswagen

You’ve already heard enough spiel on “Big Data”. You have submitted to its might and have accepted that it is indeed going to change the world as we know it. This blog is not another high voltage pitch about how big ‘Big Data’ really is! We attempt to illustrate how insights that can be drawn from user generated buzz and then applied for consumer understanding, product design and brand positioning.

Honda and Volkswagen are some of the most talked about auto brands. Not surprising therefore is the fact that the chatter around these brands is worth thousands of comments every month! Amidst all the chatter about new releases, product features, technical questions, rave reviews and consumer complaints is a gold mine of information. Here is a showcase of what we learnt from the past 90 days of data collected across Facebook, Twitter, Mouthshut, Zigwheels, Carwale, Cardekho & Team BHP.

How do the brands stack-up in the perceptual map?

There are many ways one could slice and dice the perceptions, we chose “premium-ness” and “innovativeness” as the dimensions.  Based on the data, below is the perceptual map and the relative positions of the brands.

brand perceptual mapping using big data

Overall, the buzz volume around brand Honda is much more than Volkswagen’s, primarily driven through the Facebook platform. Diving deeper into what people are talking about reveals that both in % and absolute numbers, brand Volkswagen is perceived as “innovative” versus brand Honda. About 30% of the positive buzz about Volkswagen have reference to innovation-related keywords. In contrast 4% of the positive comments on Honda relate to innovativeness.

Characterizing the buzz through visualization

Honda buzz words
Honda buzz words
Volkswagen buzz words

Volkswagen fans frequently refer to technology terms such as TDI, TSI & DSG and much of the conversation is around the technology features being introduced in the new models. The comparison of the brand is mostly with Skoda followed by Suzuki.

In contrast, Honda fans frequently comment about looks, interiors, price premiumness which the brand commands as well as quality. The competition here is Suzuki prominently and therefore expectedly, the comparison is value for money, tangible and intangible.

Engagement indices: Honda does a significantly better job on Twitter engagement metrics

The overall buzz is higher for Honda, perhaps due to its longer history in the country. The engagement metrics vary across platforms. Honda seems to run regular engaging brand campaigns on Twitter resulting in an overall higher buzz volume and engagement indices in comparison to Volkswagen. On the other hand, Volkswagen engages a higher % of its fans on Facebook versus Honda.

Honda vs volkswagen comparison

Key takeaways

The brands are perceived quite differently by their respective audiences. Honda is more a “quality” product which commands a premium, while Volkswagen is seen as one which brings in the technology edge. This is more pronounced in the team BHP forum, where you’d find auto-purchase influencers. The compared brands and therefore closest competitors seems to be Skoda for Volkswagen and Suzuki for Honda.

For a more detailed report or similar assessments reach out to ravi@genylabs.io